
In my previous blog post about coffee I discussed parameters you can influence once you have purchased your precious beans. These were brew ratio, total dissolved solids, extraction yield, grind size, water composition, water temperature and filter material. This time I want to turn my attention to what is actually in the cup. Normal black coffee is more than 98.5% water. The typical 1.2-1.5% of total dissolved solids (TDS) means that in 1 liter of brewed coffee there are 12-15 grams of solids that have been extracted from about 60 g of coffee grounds.
The compounds extracted is what gives coffee color, taste and aroma. If you analyze a cup of coffee with chromatographic techniques which are capable of separating individual chemical components you will find that coffee contains hundreds, if not thousands of different molecules. Many of these are known and characterized, yet some remain unknown. An aroma extract dilution analysis (AEDA) from 2002 revealed that 13 of the 40 key odorants in coffee were unknown [1]. One reason can be that they are present in very low concentrations, making it difficult to obtain a sample of sufficient size for a full structure elucidation. Another reason can be that the molecule is large – this complicates the process of resolving the correct molecular structure. A study from 1996 describes how, based on 22 key volatile compounds found in coffee, it was possible to synthetically make two “model” coffees that mimicked Arabica and Robusta coffee [2]. These model coffees were described as “clearly coffee-like” by the assessors. This suggests that 22 compounds is far from being enough to perfectly mimic coffee aroma. I want my cup to be more than “clearly coffee-like”, so I do not expect any competition from “synthetic” coffee very soon.
If we look at all the compounds in coffee they can be grouped into volatile and non-volatile compounds. The volatile compounds are those that will find their way into your nose and contribute the aroma of coffee, whereas the non-volatiles contribute to how coffee tastes on the tongue. Some molecules can affect both aroma and taste, but normally the taste threshold is much higher than the odor threshold. Tastes encountered in coffee include bitterness, sweetness, acidity and astringency. Non-volatiles (such as oils) as well as insolubles (think tiny particles) contribute to the body and texture of coffee. If we take a closer look at the soluble components that constitute a cup of coffee we find carbohydrates (sugars and soluble oligosaccharides), acids, minerals/salts, proteins, lipids, caffeine, volatile aroma compounds and also a large chunk of unidentified compounds, many of which likely contribute color and/or bitterness to coffee.
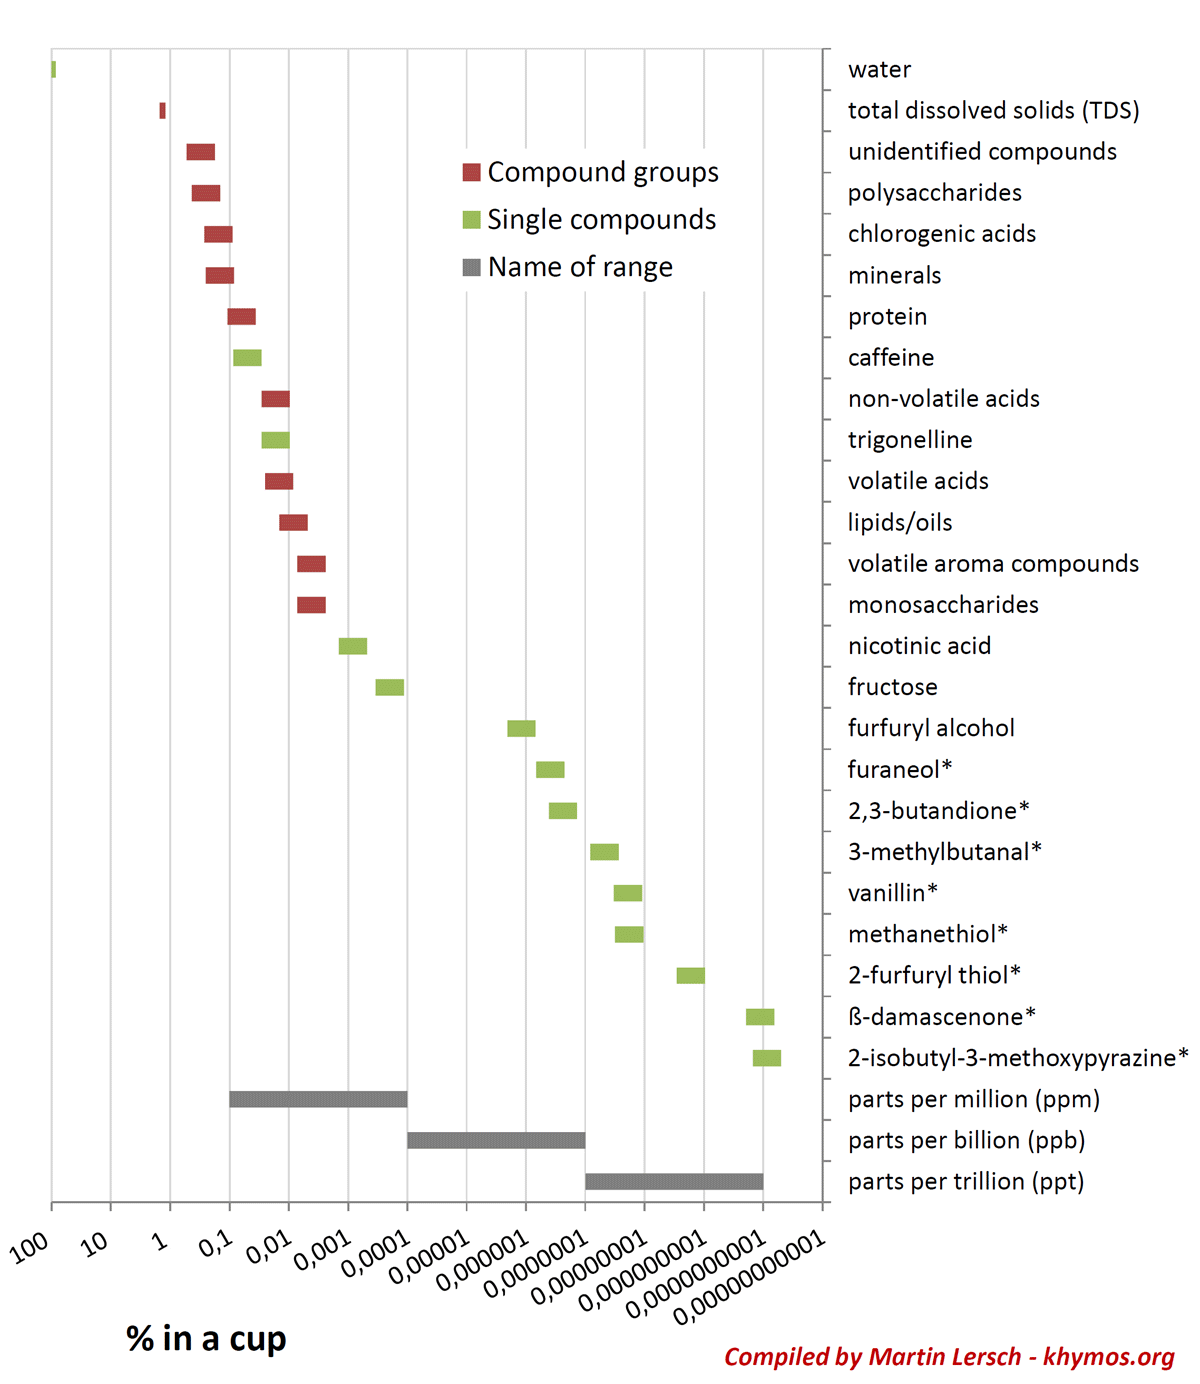
To illustrate the compounds encountered in coffee I’ve plotted their concentration ranges in percent (%) of the beverage, assuming a +/- 50% range for all except total dissolved solids (TDS) and water (see plot below). I’ve included groups of compounds (colored red) as well as single compounds (colored green). The single compounds have been selected to illustrate the range, and those that have been identified as key odorants in one of the two studies mentioned above are marked with a star (*). The scale is logarithmic, so the concentration range shown spans more than 9 orders of magnitude, which in itself is quite remarkable. I’ve also included bars to illustrate the parts per million (ppm), parts per billion (ppb) and parts per trillion (ppt) ranges. It is tempting to think that a lower concentration means lower impact. While this is true for individual compounds in the linear region, it is not true when we compare different compounds. The reason for this is that the sensitivity of our nose to each and every compound is unique. Each compound will have a different odor thresholds. This means that a compound present at 0.0000000001% could be as important for the overall flavor as a compound present at 0.01%!
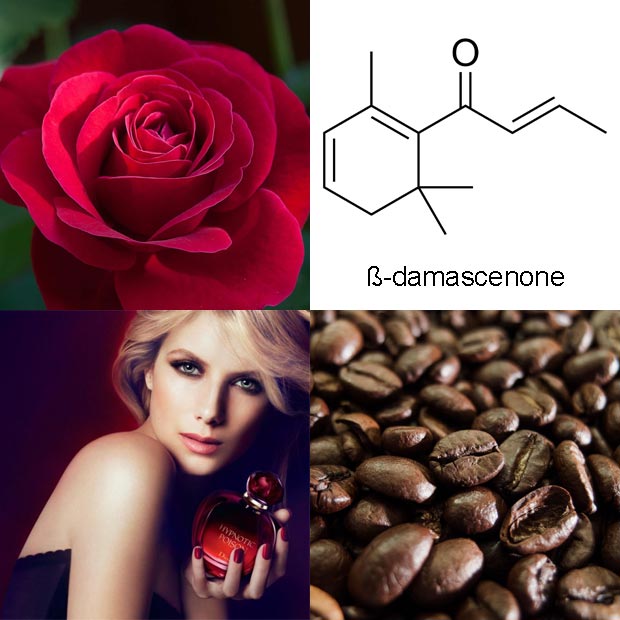
- odor: natural, sweet, fruity, rose, plum, grape, raspberry, sugar, woody, earthy with green floral nuances
- flavor: woody, floral, herbal, green and fruity with spicy tobacco nuances
Accurately measuring odor thresholds and quantifying compounds at such low concentrations is tedious work, so it’s not unreasonable to think that additional key odorants in coffee may be discovered in the years to come.
The compounds found in coffee can also be grouped into polar and non-polar compounds. The group of polar compounds will include acids, minerals, proteins, and carbohydrates, and their common denominator is that they are very soluble in water. Or to put it differently: water as a polar solvent is able to extract more than 75% of the polar compounds [2]. In the group of non-polar compounds we find the volatile compounds contributing smell as well as lipids. The solubility of these in water is low, and as a result typically only 10-30% of the non-polar compounds are extracted when brewing coffee with water. This is something to keep in mind when discussing extraction of coffee and extraction times. In order to explore additional dimensions of coffee extraction one could consider the use of a less polar solvents such as ethanol!
In the figure above I included the typical range of TDS (1.2-1.5%) in normal black coffee. TDS is a good measure of coffee strength, but by studying the concentration ranges you will appreciate that only a few of the compound groups in coffee are present in sufficient concentrations to have an actual influence on TDS. This would be no problem if we could assume that the compounds present in minute quantities were extracted at the same rate as compounds that influence the TDS. The problem is that such a correlation does not exist. It suffices to point to the large difference in extraction yields between the polar and non-polar compounds. This is why TDS measurements will only get you so far. It remains the easiest way to measure the strength of coffee, but a TDS measurement is very poor at predicting the aroma and flavor in a cup of coffee. An experimental approach with our nose as a superb analytical detector remains the method of choice for most of us as we continue to explore the wonders of coffee extraction.
References
[1] Sanz, C.; Czerny, M.; Cid, C.; Schieberle, P. Eur. Food. Res. Technol., 2002, 214, 299 (DOI: 10.1007/s00217-001-0459-9)
[2] Semmelroch, P.; Grosch, W. J. Agric. Food Chem. 1996, 44, 537 (DOI: 10.1021/jf9505988)
[3] Belitz, H.-D.; Grosch, W.; Schieberle, P. (ed.), 2004, Food Chemistry (3rd edition) Springer.
[4] Amanpour, A.; Selli, S. J. Food Proc. Pres. 2016, 40, 1116 (DOI: 10.1111/jfpp.12692)
[5] Batali, M. E.; Frost, S. C.; Lebrilla, C. B.; Ristenpart, W. D.; Guinard, J.-X. J. Sci. Food Agric. 2020, 7, 2953 (DOI: 10.1002/jsfa.10323)